LTstatsDemo | GitHub
LTstats is a lightweight resource monitoring system (currently limited to systems running Linux), with various main features:
- Agent-server architecture, no special permissions or ports required
- Low resource usage
- Web interface with status pages, charts with historical data and an admin interface
- Notification support, both up/down notifications and resource thresholds
- Saving the data locally in memory in case the server is unreachable
- Secure: both the server and the agent run as unprivileged users and all install scripts verify all checksums before using binaries, and the install commands also verify the downloaded scripts before using them
- Rather easy setup
- Simple, less than 3k LoC of C code (backend) and less than 2k LoC of JavaScript (frontend), the frontend can also be modified easily
LTstats is divided into an agent part that runs on the systems that should be monitored and collects various datapoints (kernel, processor, CPU cores, uptime, CPU usage, CPU iowait, CPU steal, RAM total and usage, swap total and usage, disk total and usage, network traffic and disk IO) and uploads it to the server, and the server part, which is only running on one server, has three main functions: saving the data, sending notifications and displaying the web interface. Both the agent and the server are written in C and don't use much storage/RAM (the agent uses around 250 KB storage and 300 KB RAM, the server around 150 KB storage and 500 KB RAM (depending on the count of monitors)). The storage usage of the statistics are around 20 MB/monitor/year with default settings (40 bytes per datapoint and one datapoint per minute).
LTstats is licensed under the GNU General Public License 3.0 (GPLv3).
Table of contents
- Caveats
- Installation/Quickstart
- Upgrading
- Backups
- Public/private settings
- NTP
- Scalability
- Manual installation
- Security
- Requirements
- Notifications
- Web interface
- Dependencies
- Storage
- Docker (not recommended)
- Uninstalling
- Screenshots
- Download
Caveats
- Currently only x86_64 is supported, ARM support is planned
- Only Linux systems are supported (for now)
- Possibilities for automated deployment of agents across a large fleet are limited
- Single-user (the admin user)
- (TLS) reverse proxy is necessary
- Limited debugging possibilities
- Not as much is monitored compared to other solutions, and, for example, if multiple partitions are monitored, one can't view statistics for each one individually because this would require variable-length datapoints
Installation/Quickstart
You can either compile the individual programs yourself, or you can use the precompiled binaries. If you use systemd (I don't like it, but as it's standard on many distributions and I currently don't have servers with other init systems to test install scripts, there's currently only an installer for systemd. If you use another init system and want to create an installer for it, feel free to open a pull request), you can use the install script which will ask you for any relevant parameters, for example like this:
curl -s https://ltstats.de/v1.3/systemd:server | tee install.sh | sha256sum -c <(echo 28d299fa4e0af214efb8bac1196e32261a78ebe5e2070b213146371240bdddd0 -) && bash install.sh
Important: all install scripts (agent and server) have to be run as root. Also very important: choose a secure password! You can also use the docker image, however, this is NOT recommended. After installing, you might want to set up notifications, for that, see below.
Important: You need a webserver of some kind for the TLS termination. The webserver should listen on port 443, support TLS 1.0, 1.1 or 1.2 (due to BearSSL not supporting TLS 1.3), and simply proxy the requests to the server (127.0.0.1:PORT where PORT is the configured port).
Upgrading
To upgrade, first read the release notes to ensure that no special precautions have to be taken, and then just run the latest install script (this works for both agent and server, however the server should always be upgraded first). If necessary, the scripts should handle any conversions (if, for example, file formats changed) themselves. For docker, this is best-effort only.
If you want to deploy the new agent after the upgrade, you can go to the "Settings" tab on the admin page and re-select the appropriate command to copy.
Upgrades can be server-only, so the agent install command (and the version in it) doesn't necessarily change.
Backups
I recommend that you take regular backups, the data can usually be compressed to 20-40% of the uncompressed size.
Public/private settings
There are multiple things that can be set to public or private:
- Monitors themselves: if set to private, certain things will be hidden unless the user is logged in, you can configure what exactly should be hidden in the settings page of the admin interface.
- Status pages: if set to private, they cannot be seen unless the user is logged in
- Notes: if set to private, they will be hidden unless the user is logged in
NTP
An accurate time is required (less than 5s deviation is optimal) for both the server and the agent. You can either use an NTP client of your choice or use the minimal client included here. Optimally you should only have one NTP client per system running as they could otherwise interfere with each other. If you enable the NTP client, the install scripts will try to check if other NTP clients are already running (systemd-timesyncd, chrony, ntp, ntpd), and only install the minimal NTP client if that check doesn't find any other installed clients.
Scalability
Generally, LTstats can handle thousands of monitors without a problem, but you will have to increase the fd limit if you have over 1000 monitors. The LTstats server is simply an accept()->read()->fork() model (fork only for the web interface requests, not for agents uploading data), this means that the latency between the reverse proxy should be the lowest possible as otherwise reading will take too long, so, unless impossible, the reverse proxy should be on the same server as the LTstats server.
Manual installation
If you want to manually install the server, you have to do a few things:
- Optionally, compile LTstats
- Create a directory where the data will be stored and copy
{status,monitor,admin}.htmlto that directory - Create
data.jsonwith at least the following content:{"time":1,"hash":"SHA256_HASH_HEX","monitors":{},"pages":{"main":["Main page",true,[]]},"hide":[],"notifications":{"every":60,"exec":[],"sample":30},"copy":""} - Start the server with the following arguments:
{PATH} {MAX_CHILDREN (a reasonable value is 10 to 200)} {PORT}
Security
No special privileges are required for the agent and server, by default it will create and use the ltstats user. Regarding the bash scripts and precompiled binaries: to ensure that neither has been tampered with, checksums are used. Additionally, the binaries should be reproducible, meaning that if you compile them yourself with the same version of all tools (debian stable is used for the releases) and libraries, it should result in the exact same binaries.
Requirements
The binaries are statically-compiled, so there are no user-space dependencies like libc. Only two requirements have to be met in order for the agent to work, and only one for the server:
- Linux (any kernel compiled in the last decade should work) (theoretically it would be possible to port the agent to other OSes, however, at this time, nothing of that sort is planned)
- For the agent: procfs mounted at /proc, optimally also sysfs at /sys for reliable detection of the core count (however, this is not required)
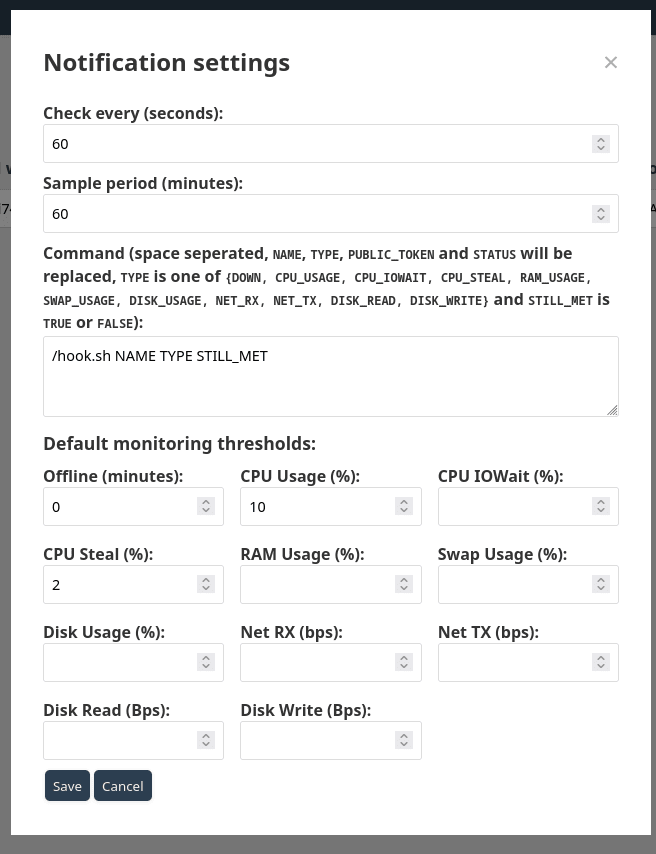
Notifications
For notifications, an user-defined program/script is called whenever a certain condition is met or is no longer met (variable STILL_MET). In the user-specified list of arguments, certain variables are replaced (NAME, PUBLIC_TOKEN, STILL_MET (TRUE or FALSE), TYPE (DOWN, CPU_USAGE, CPU_IOWAIT, CPU_STEAL, RAM_USAGE, SWAP_USAGE, DISK_USAGE, NET_RX, NET_TX, DISK_READ, DISK_WRITE)). The first argument must be the absolute path to the executable.
You can use the included msmtp hook if you want to (if you use the install script, it's saved as {BASE_PATH}/notify.sh), for that you have to create an configuration file at ~ltstats/.msmtprc or /etc/msmtprc, for example, the following is working for me:
defaults
auth on
tls on
tls_trust_file /etc/ssl/certs/ca-certificates.crt
account default
host $SMTP_HOST
port $SMTP_PORT
tls on
tls_starttls off
auth plain
user $SMTP_USER
from $SMTP_USER
password "$SMTP_PASSWORD"
Web interface
The default web interface supports both desktop and mobile devices (except the admin area) and both light and dark mode. You can modify {status,monitor,admin}.html, a restart of the server is only necessary if you didn't change the files but instead created others, and renamed them to the mentioned filenames. All API paths are listed in web.c, and you can also take a look at the JavaScript source code used in the frontend. I would greatly appreciate it if you would leave the link to the LTstats homepage in the footer.
If you want a favicon, you can simply copy favicon.ico into the directory where the data and the HTML files are stored. A restart of the server is then necessary.
Dependencies
Apart from the libc (currently musl is used), the server depends on json-c and the agent depends on BearSSL. The status pages and the admin interface do not depend on any libraries, the details/monitor page depends on ApexCharts for the graphs, however, as they changed their license from the GPL to one that could potentially cost money, a switch to another library may be necessary in the future, but for now the version licensed under the MIT license can be continued to be used, and, if necessary, small bugs can be fixed.
Storage
The data files (one per monitor, append-only) are stored in the directory that's passed to ltstats_server, and in this file, there are four (plus optionally one) additional files:
data.json: the configuration is stored in this file. Editing it manually is not recommended. For information regarding the contents/format of this file you may look inserver.c.{status,monitor,admin}.html: the web interface filesfavicon.ico: optionally, a favicon
Docker (not recommended)
Using Docker is possible (only) for the server, however, this is NOT recommended as this will use much more disk space, using custom notification methods requires rebuilding the image, and the initial configuration is limited.
If you wish to use it nevertheless, you can use the image lukastautz/ltstats:v1.1 (from Docker hub), and set the environment variables SMTP_HOST, SMTP_PORT, SMTP_USER, SMTP_PASSWORD and SMTP_SENDTO appropriately, forward port 8080, and mount a volume at /status. Then you will need to setup a reverse proxy.
The default docker password is admin, you should sign in and change it as soon as possible.
Uninstalling
You can completely remove LTstats, on systemd systems, simply execute:
- For the agent:
systemctl disable --now ltstats_agent; rm /etc/systemd/system/ltstats_agent.service /etc/monitoring_token /bin/ltstats_agent - For the NTP client (if installed):
systemctl disable --now ltstats_ntp; rm /etc/systemd/system/ltstats_ntp.service /bin/ltstats_ntp - For the server:
systemctl disable --now ltstats_server; rm /etc/systemd/system/ltstats_server.service /bin/ltstats_server(and, if you want to, also delete the data directory).
Screenshots
Click to show the screenshots
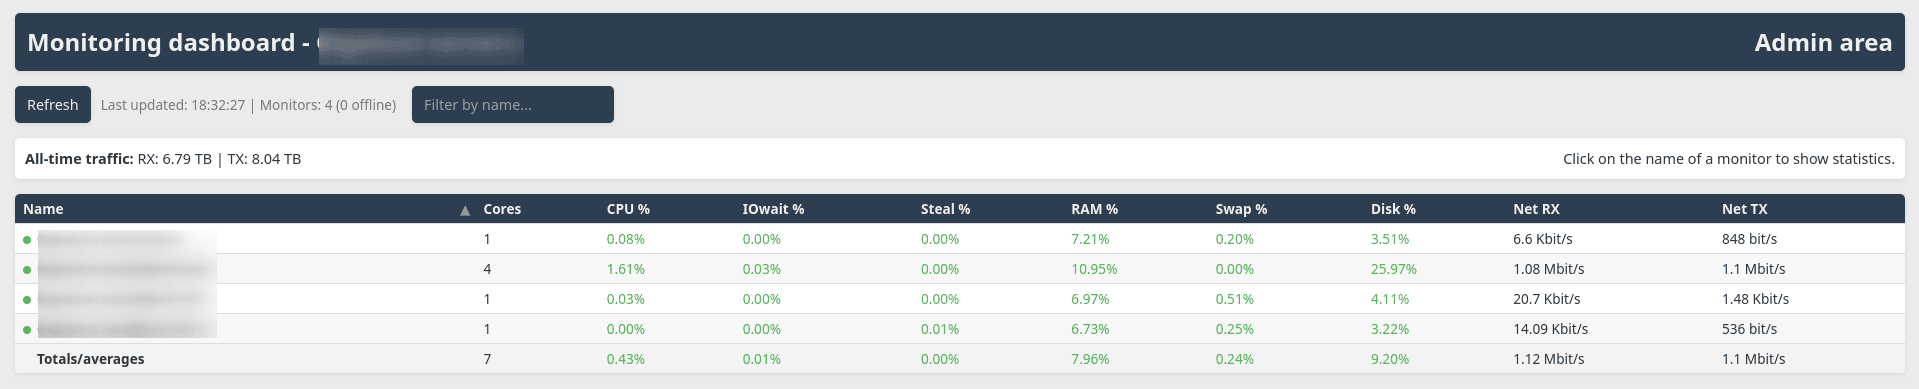
Status page (dark mode):
Status page (light mode):
Status page with private monitors when not logged in and therefore with some things hidden (dark mode):
Status page with private monitors when not logged in and therefore with some things hidden (light mode):
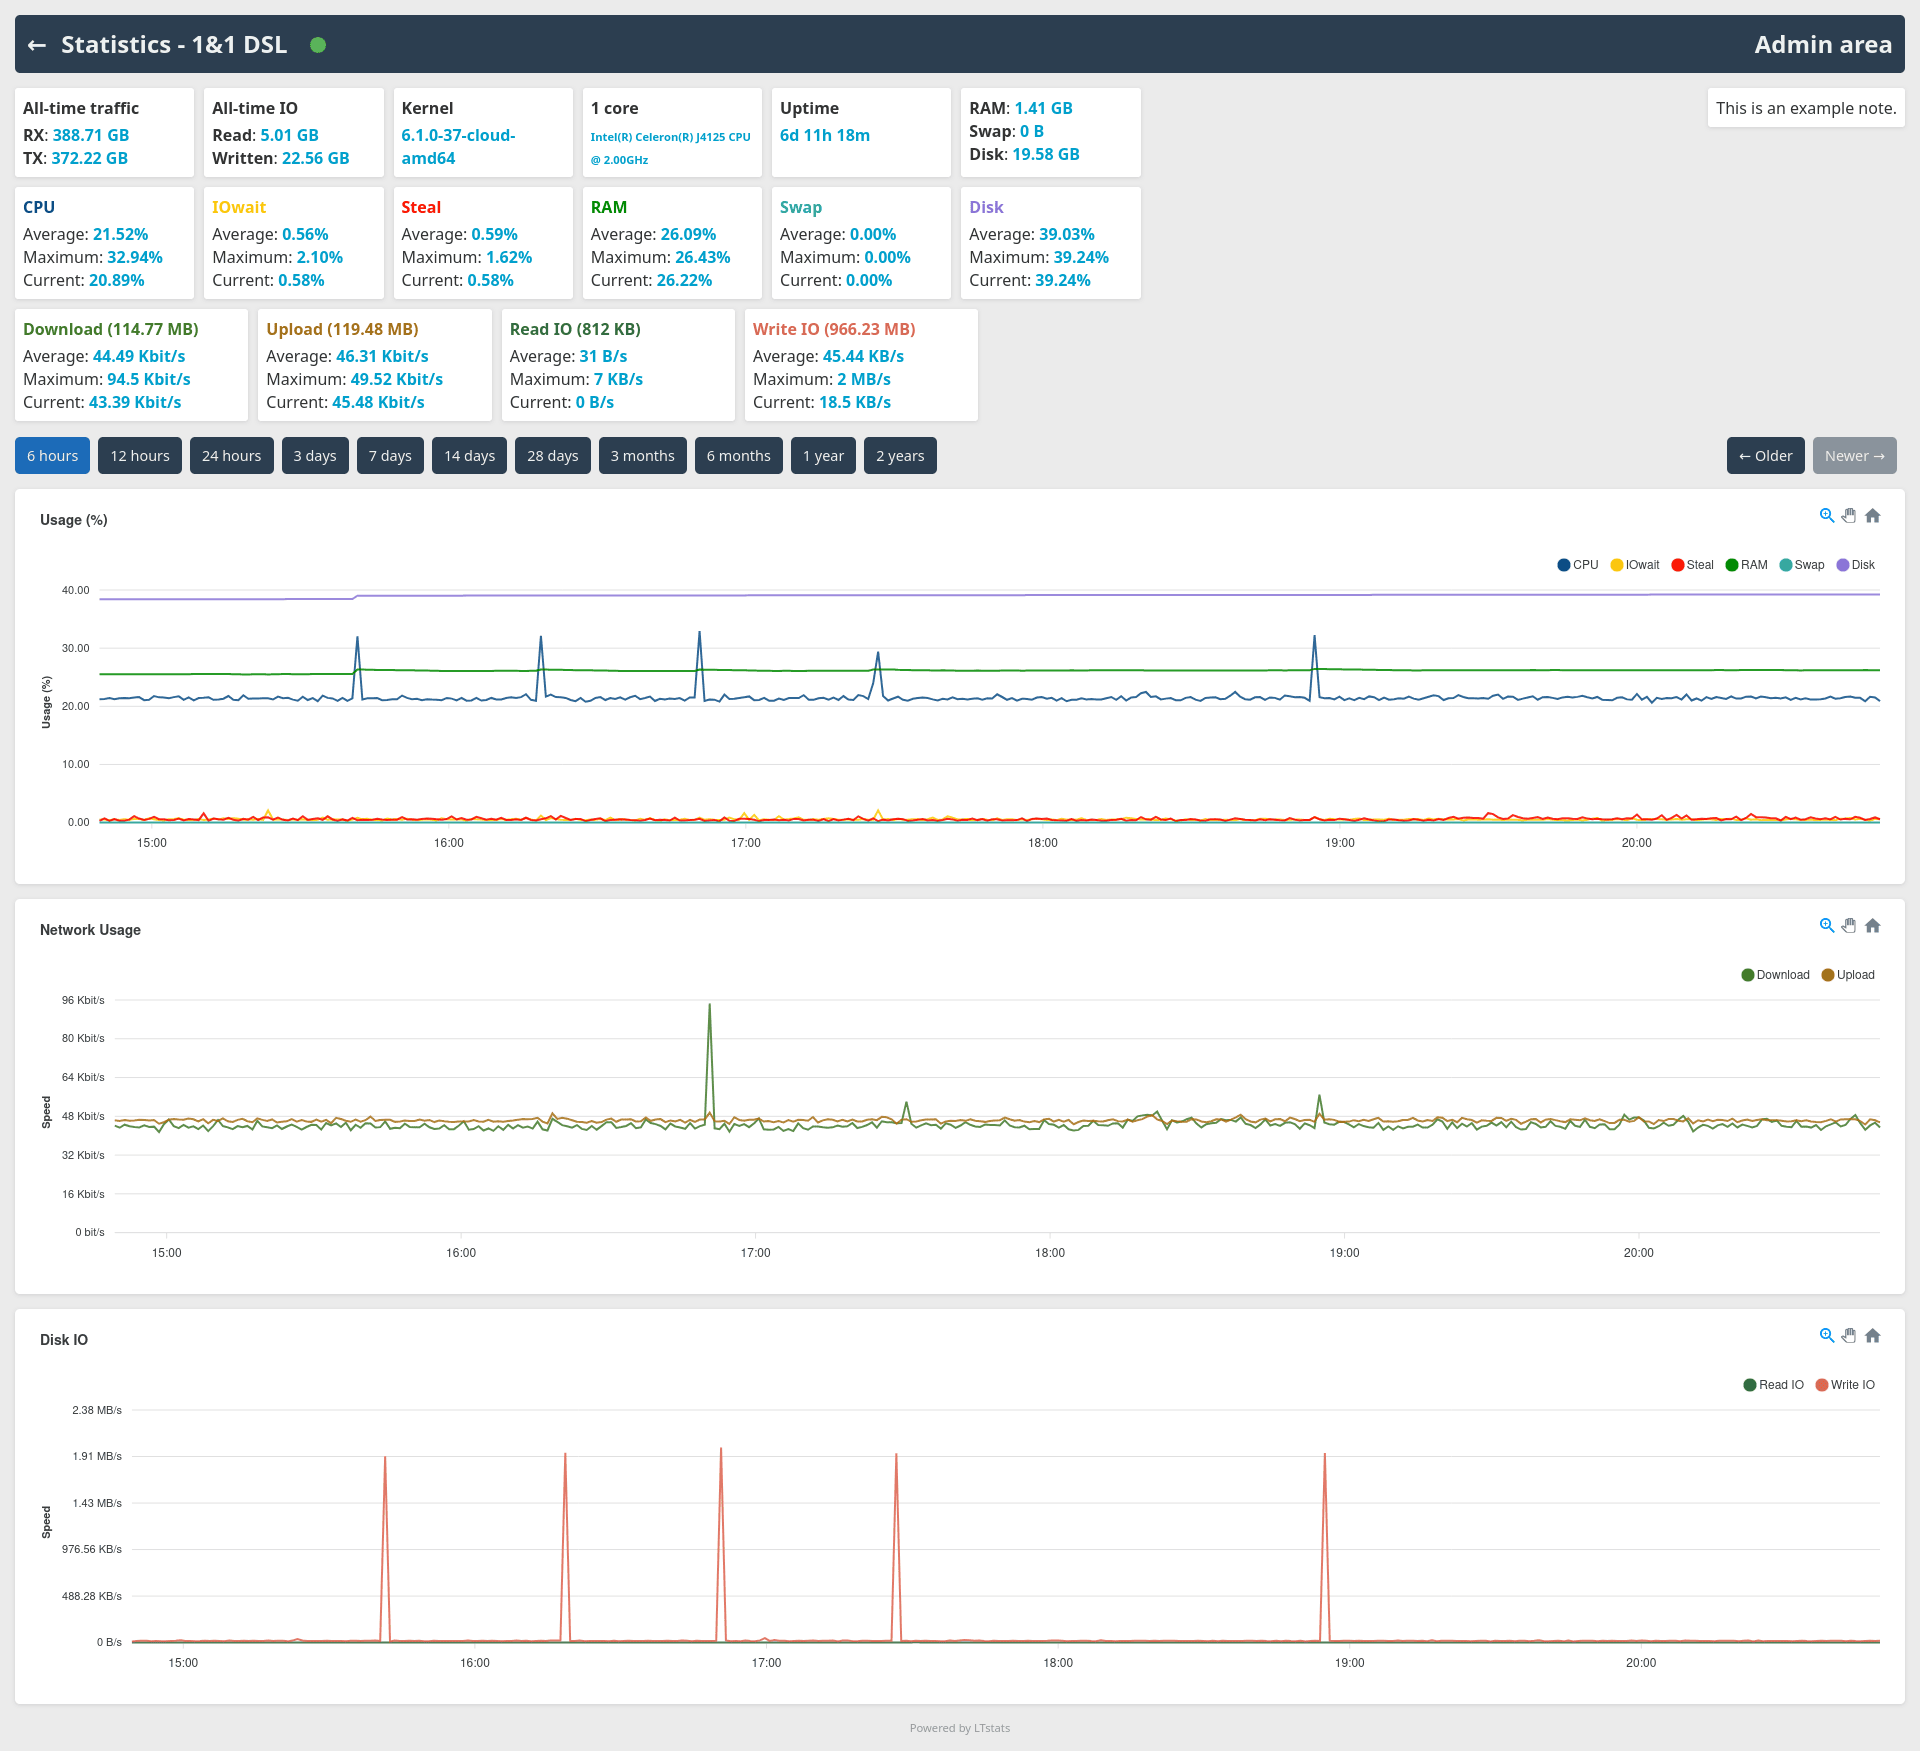
Monitor details (dark mode):
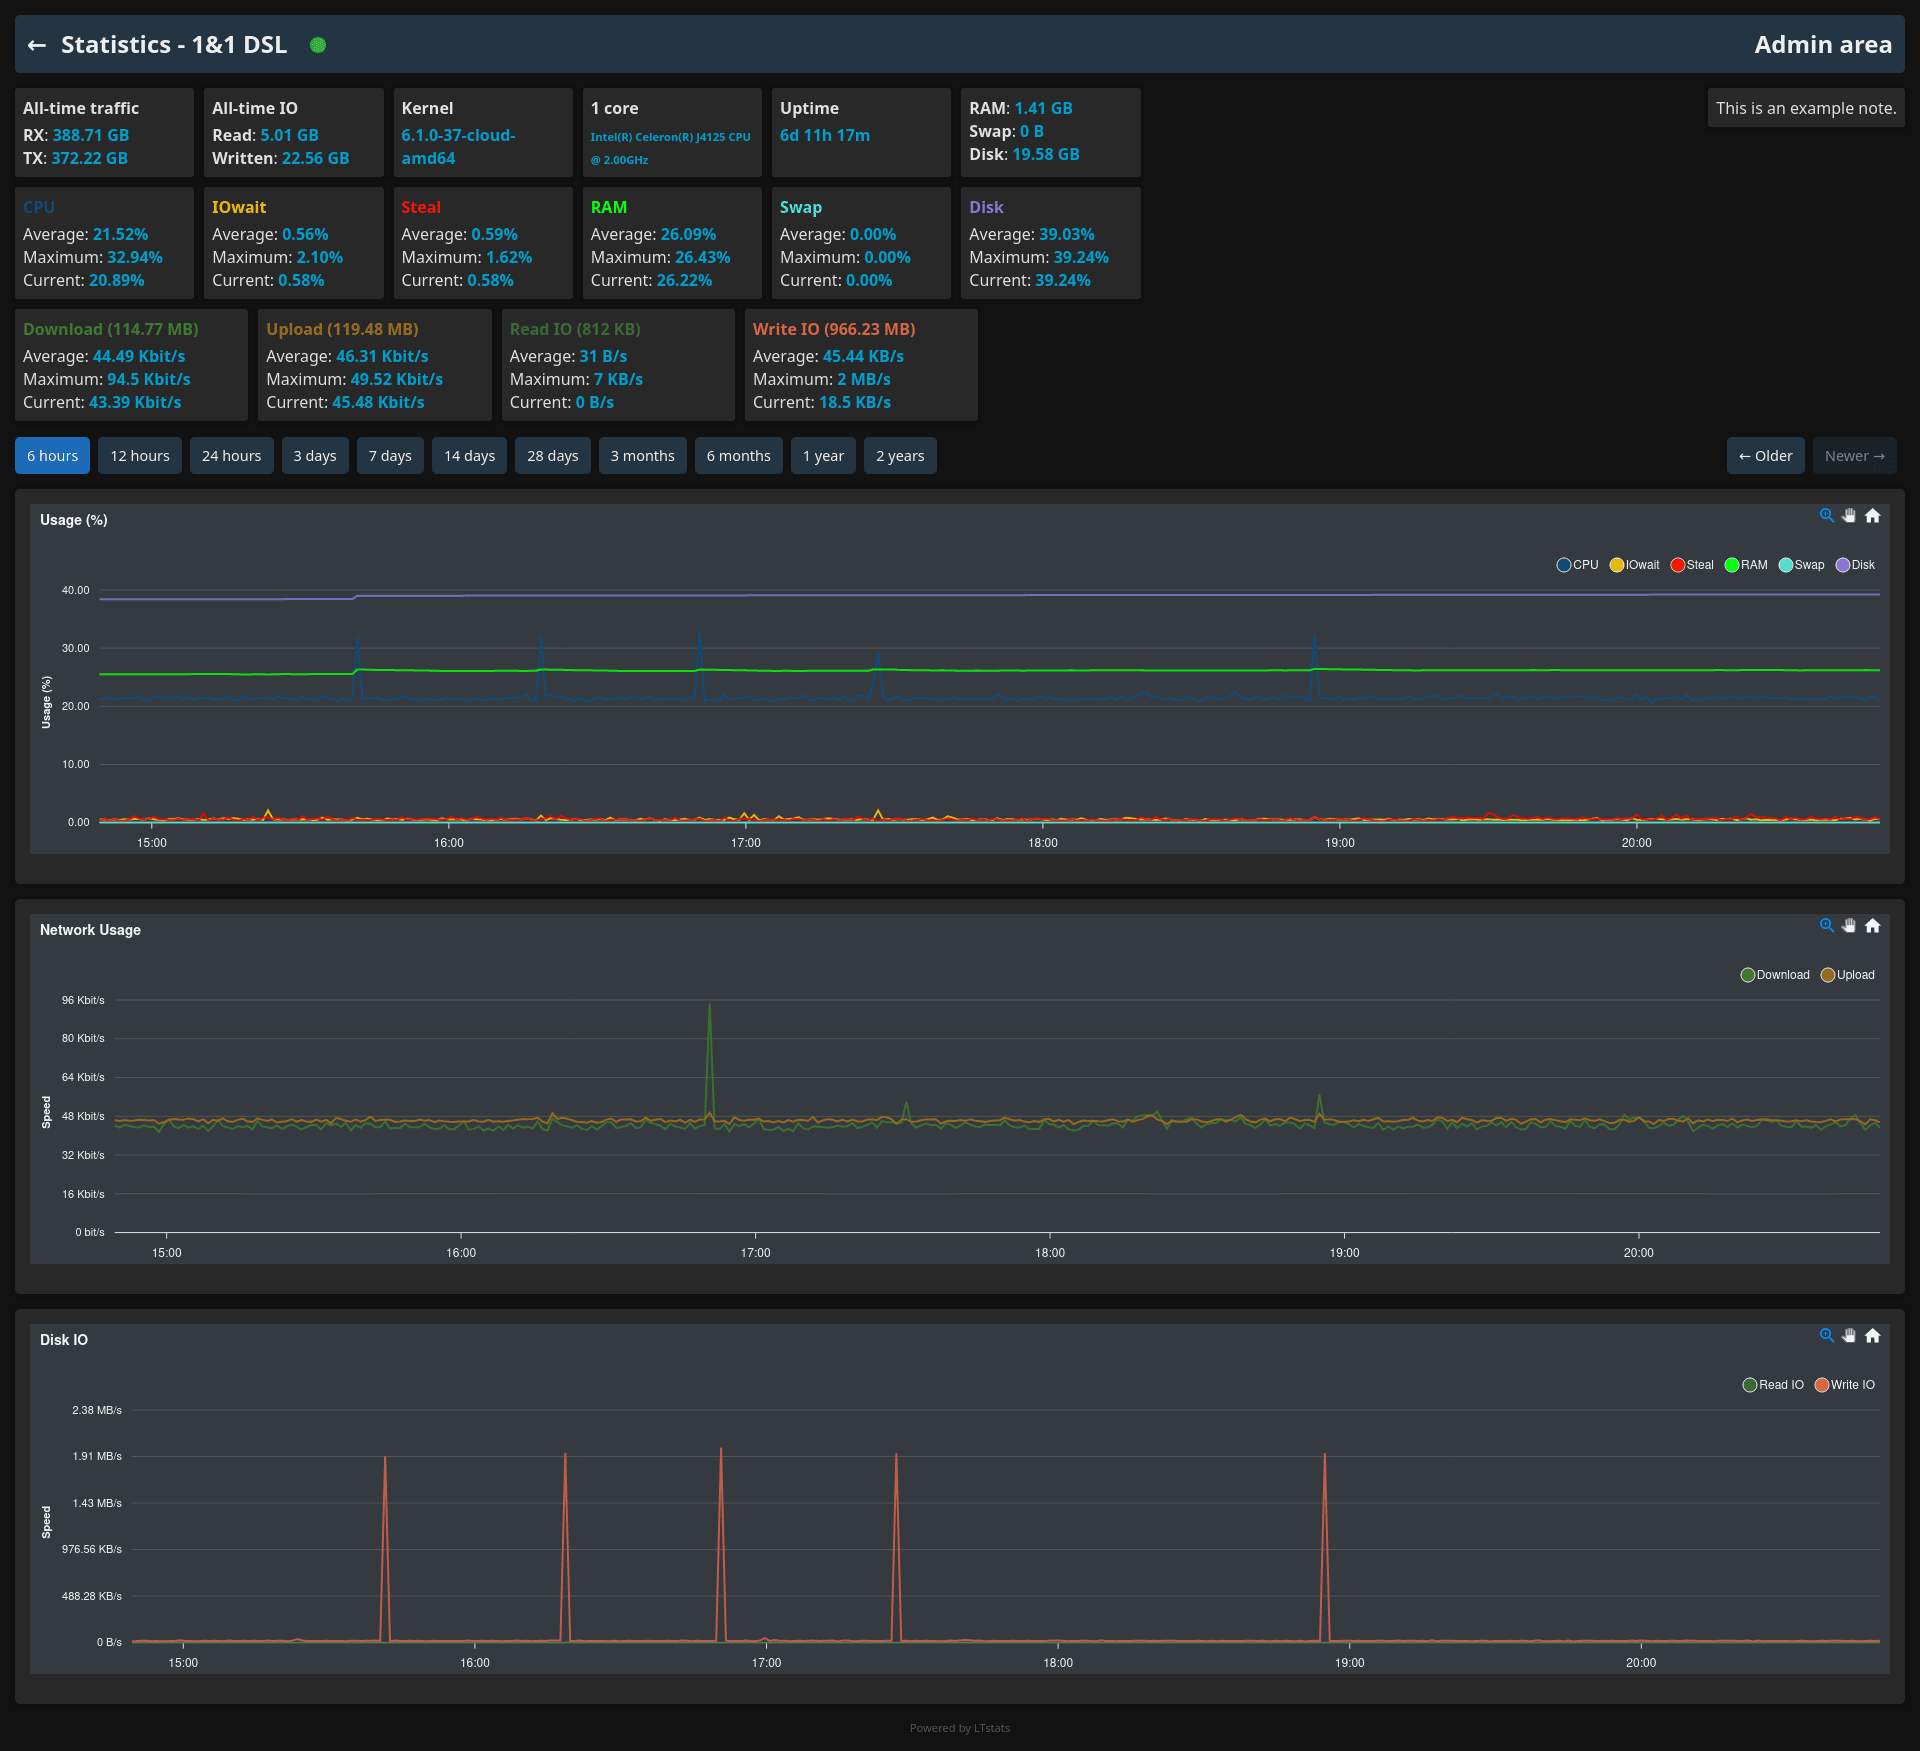
Monitor details (light mode):
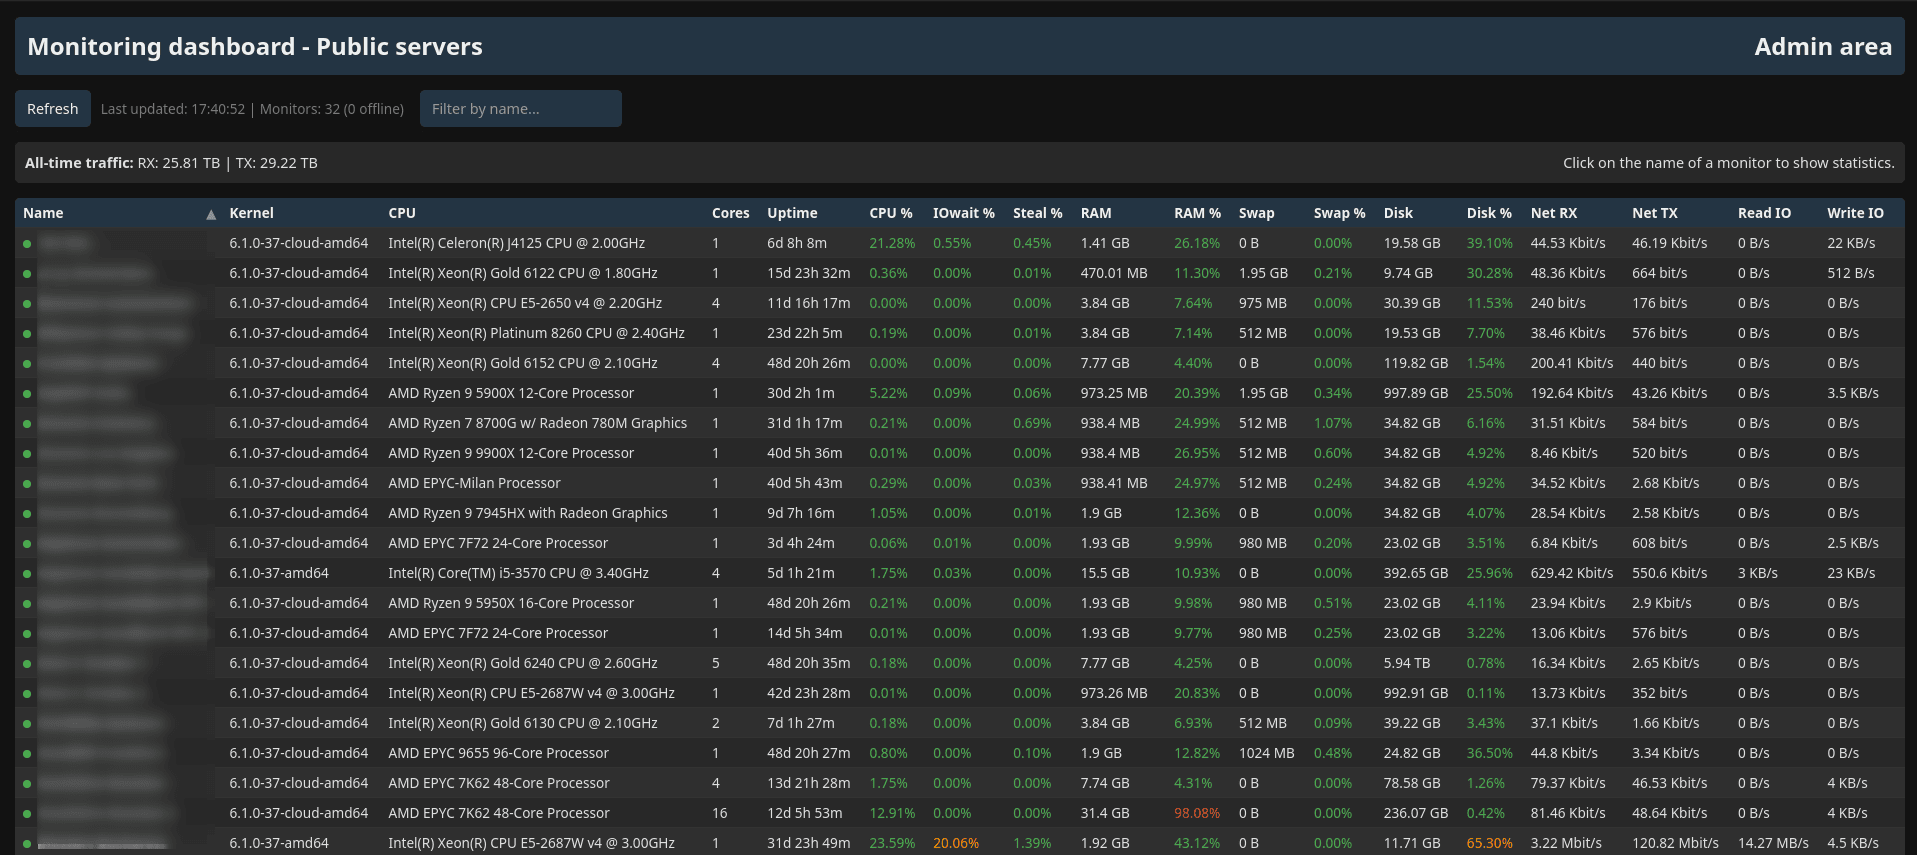
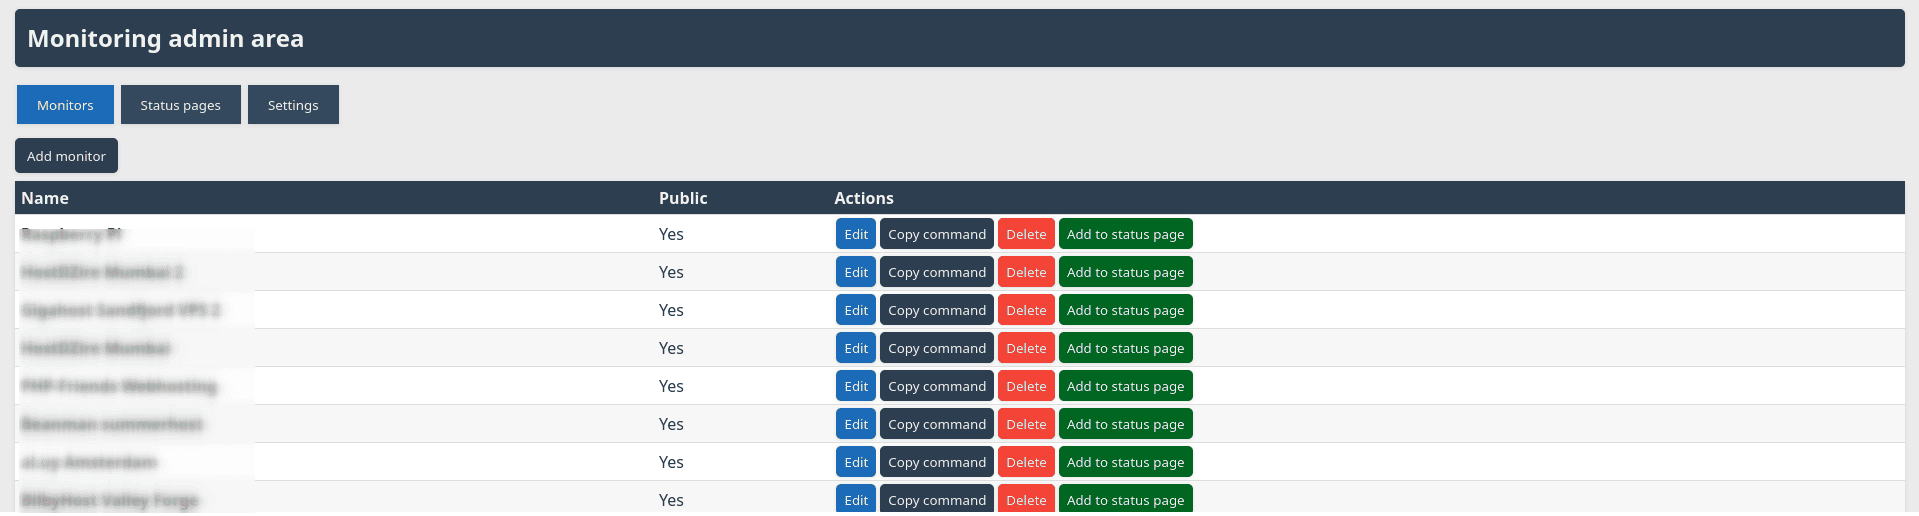
Admin area "Monitors" tab (dark mode):
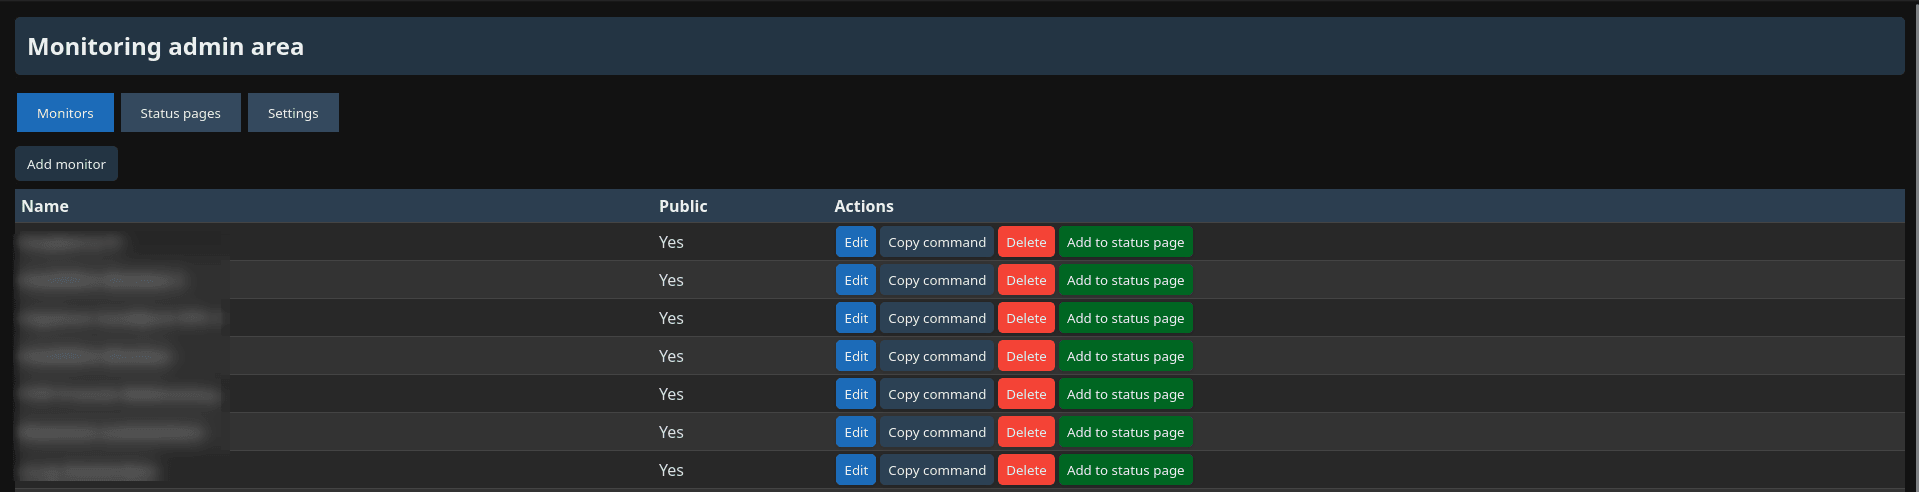
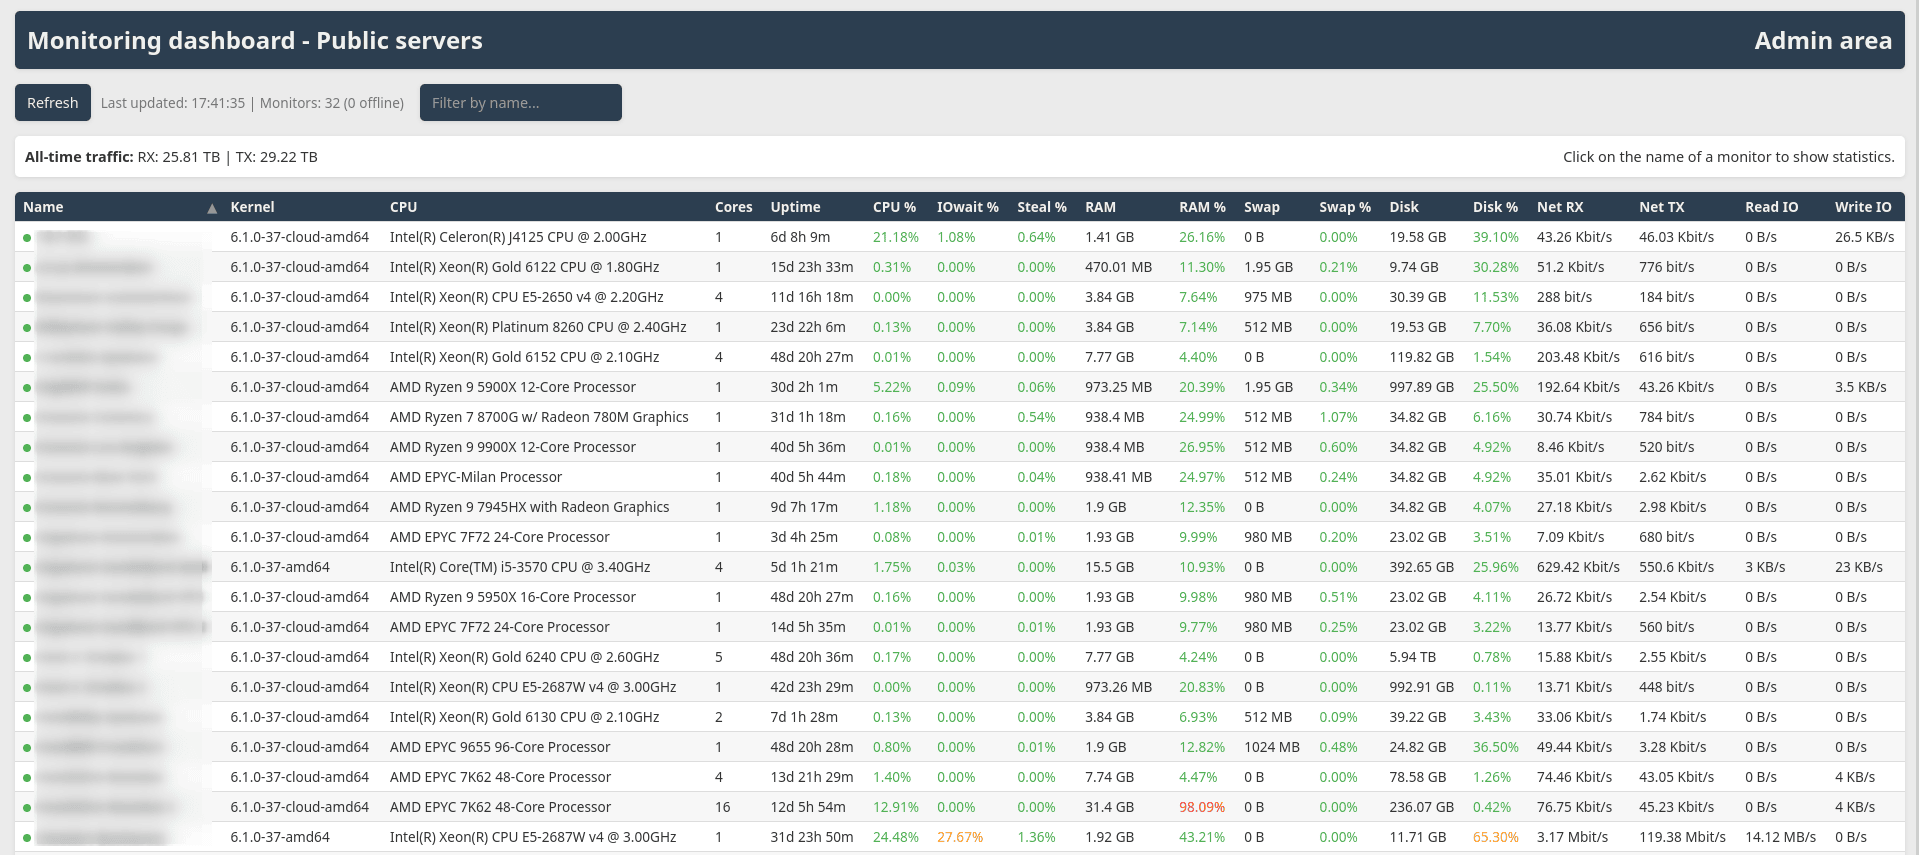
Admin area "Monitors" tab (light mode):
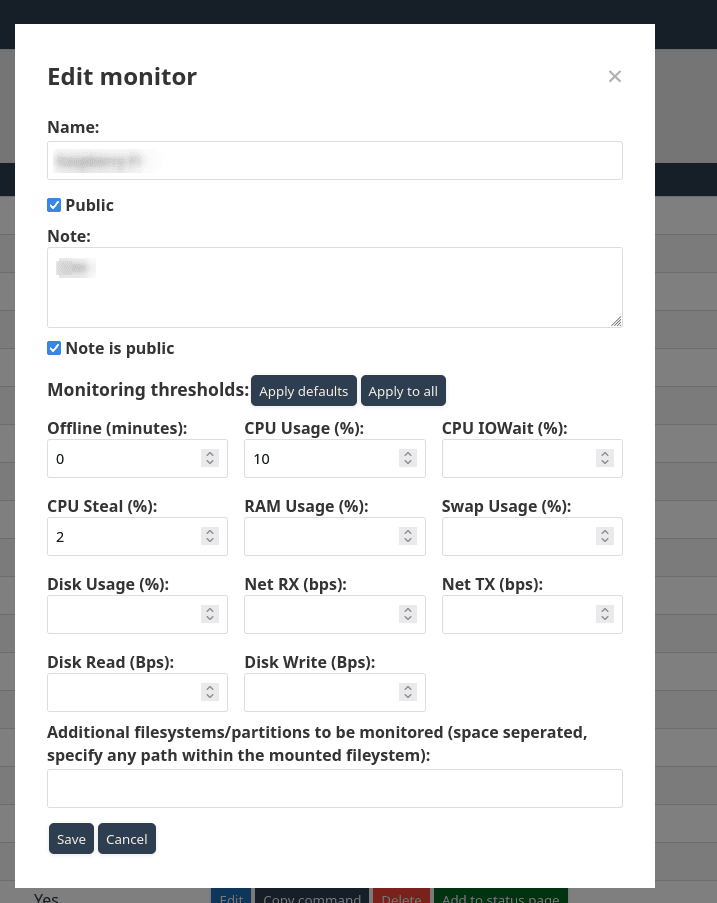
Admin area "Edit monitor" modal (dark mode):
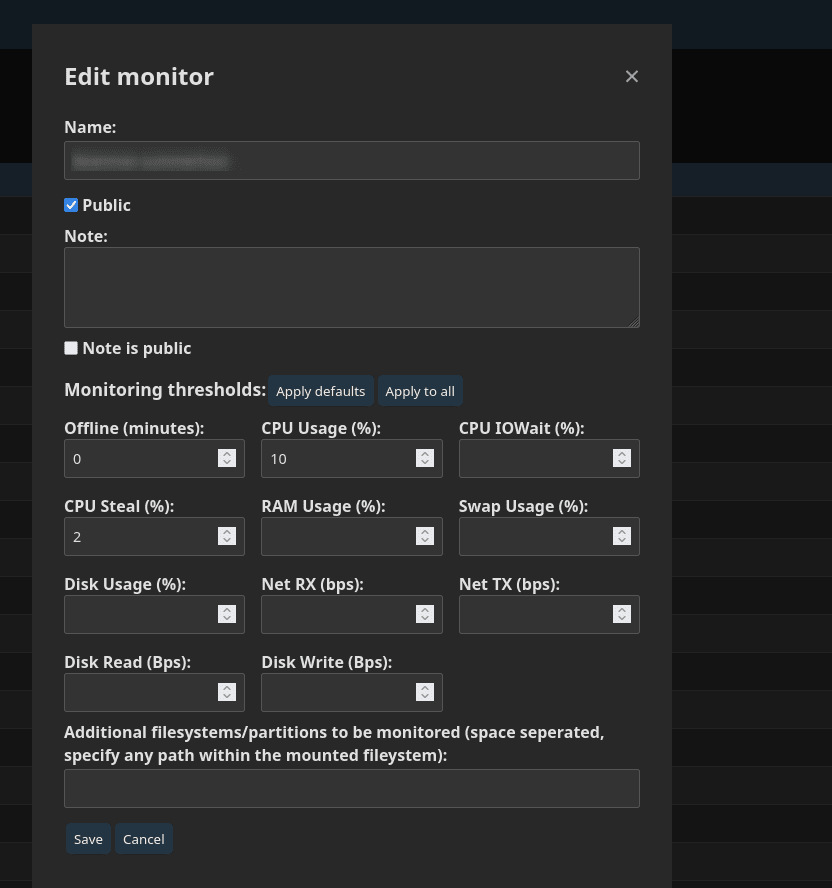
Admin area "Edit monitor" modal (light mode):
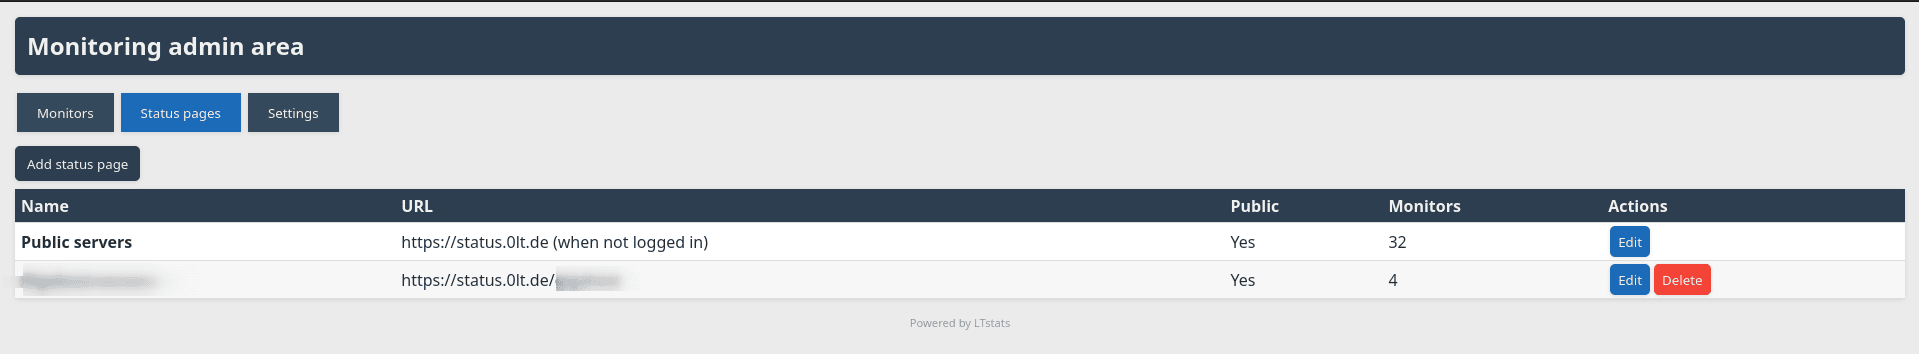
Admin area "Status pages" tab (dark mode):
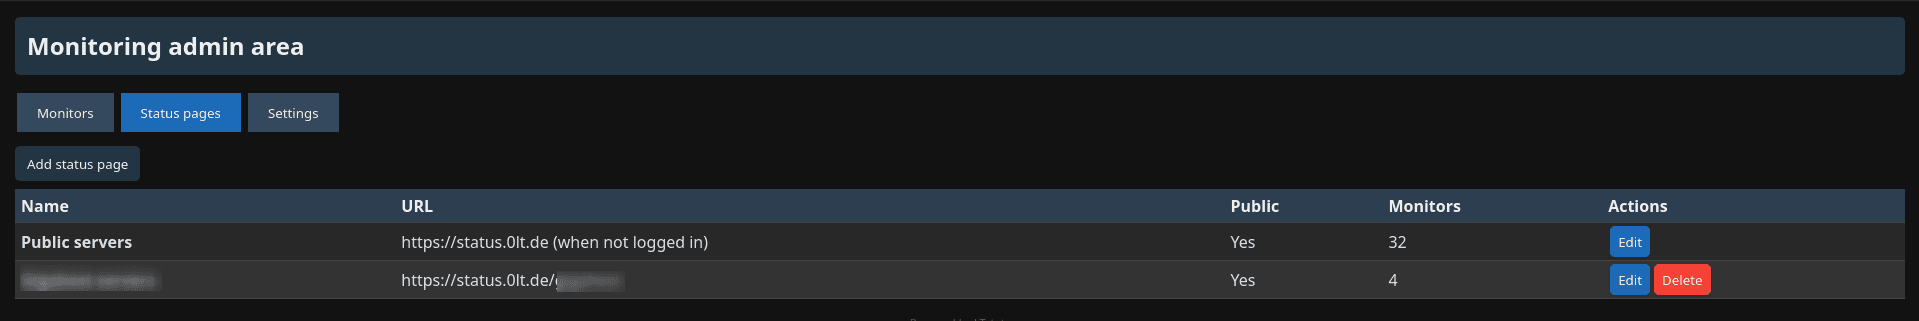
Admin area "Status pages" tab (light mode):
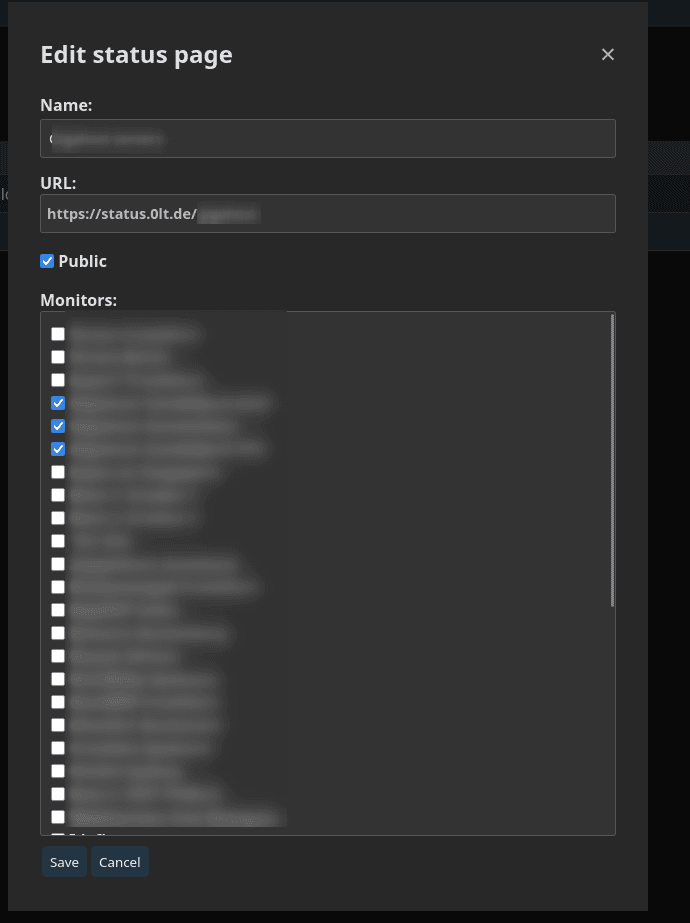
Admin area "Edit status page" modal (dark mode):
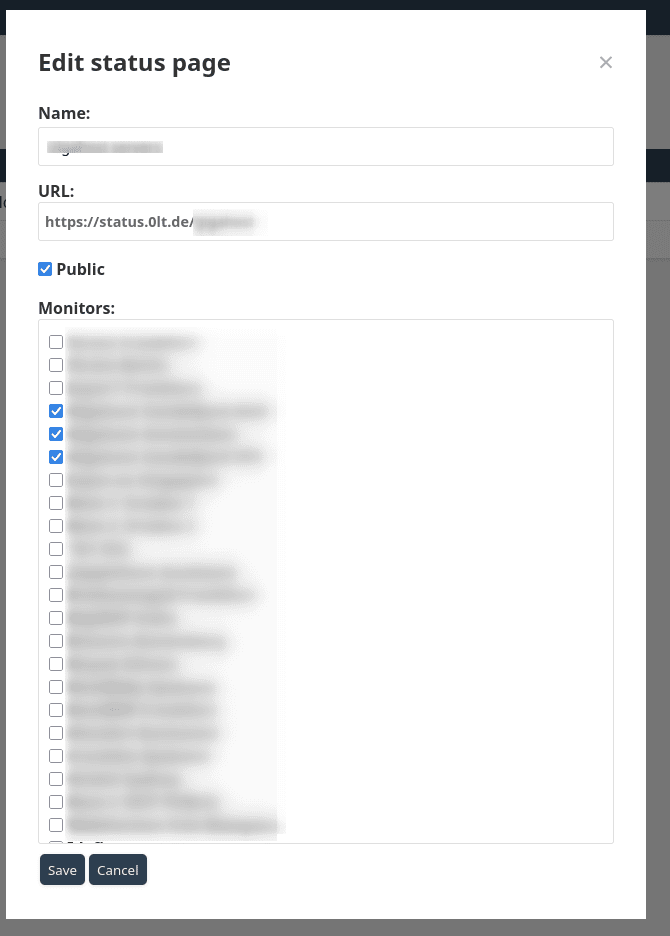
Admin area "Edit status page" modal (light mode):
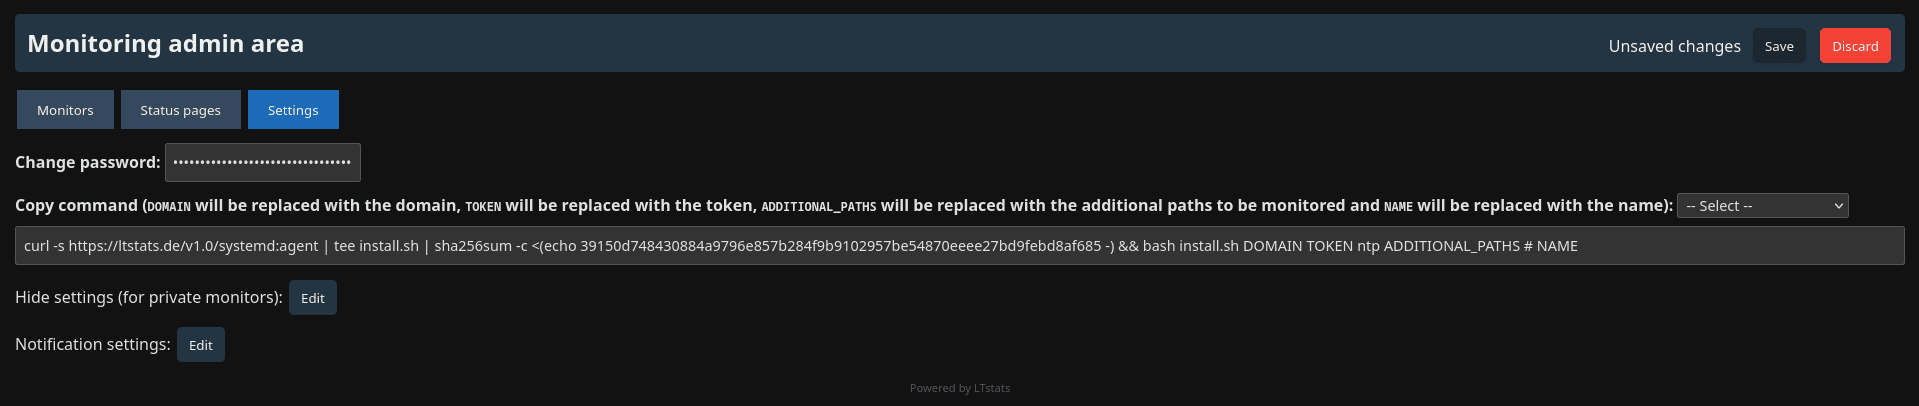
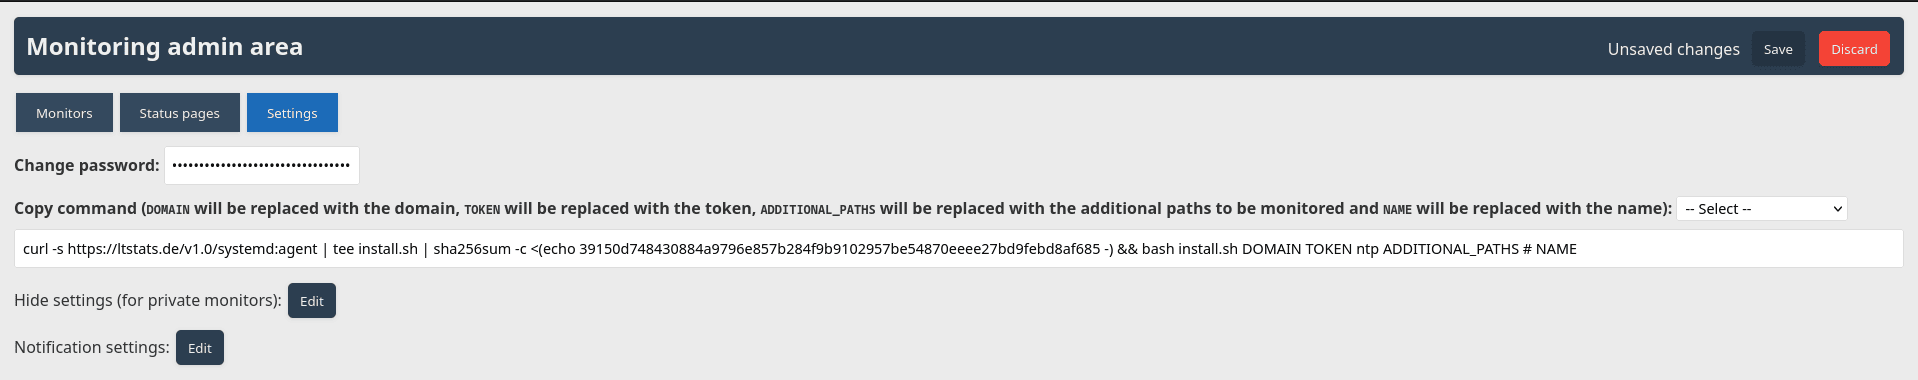
Admin area "Settings" tab (dark mode):
Admin area "Settings" tab (light mode):
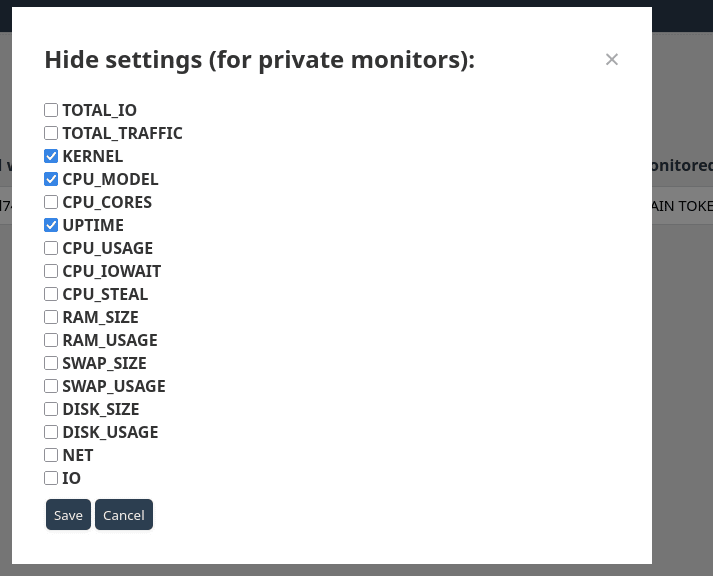
Admin area "Hide settings (for private monitors)" modal (dark mode):
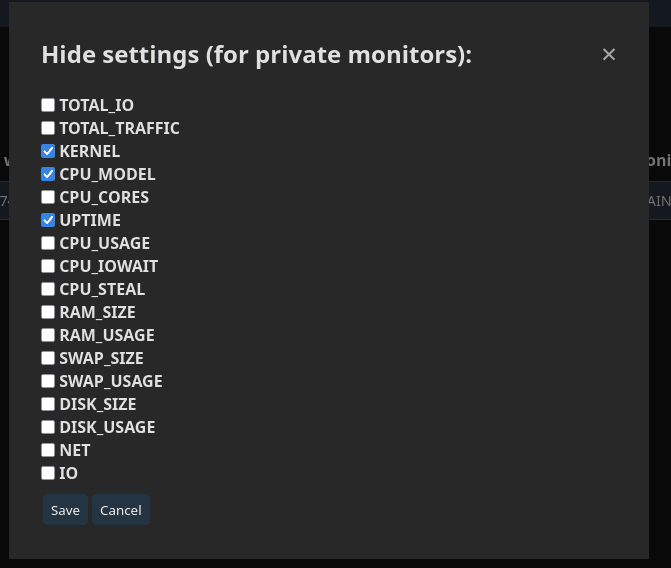
Admin area "Hide settings (for private monitors)" modal (light mode):
Admin area "Notification settings" modal (dark mode):
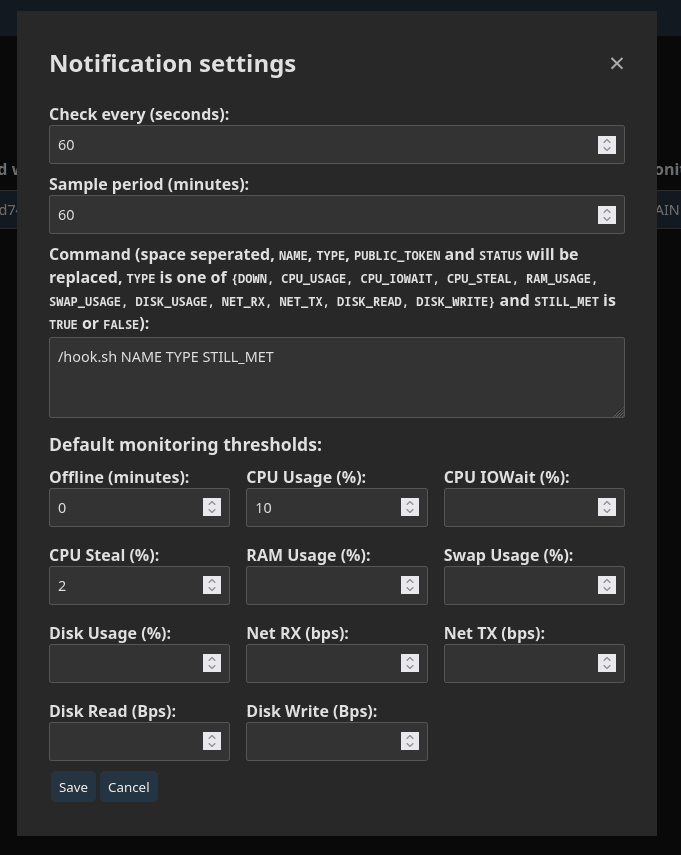
Admin area "Notification settings" modal (light mode):